PetroVisual
Improve productivity with our agile analytics – the right data at the right time in the right context. We enable you to spend more time analyzing data and less time trying to figure out how. With PetroVisual, you can:
- Easily navigate overwhelming corporate data with a catalog of approved data sources.
- Access and analyze data when you need it without spending time figuring out multiple reporting interfaces and overly complex BI tools.
- Explore data by diving deeper into related data, even data across multiple siloed databases, with just a few mouse clicks.

Solutions
Workflow Solutions
X
Connect
Easily integrate corporate data into your workflows without a big investment upfront. With our cloud configuration, you can connect, setup new data sources, and seamlessly publish to your users.
Corporate Databases
-
PetroVisual connects to a wide variety of data sources on your local drive, network, cloud database, or via web services.
-
No moving or syncing of data between environments. We access and integrate data sources in real-time using read-only privileges to safeguard your data.
-
Implementation is quick and easy without a big upfront investment.
- Your data stays secure behind your firewall.


ARIES and PHDwin Integration
- PetroVisual’s prebuilt connectors make setting up ARIES® and PHDWin project databases, whether stored on a local drive or network, quick and easy.
- View, analyze, and share your reserves databases with cross-functional teams from a single, easy-to-use interface.
- Your data stays secure in your project databases behind your firewall.
- No need for additional ARIES® and PHDWin licenses to access and share your reserves data with your teams.
Cloud Settings
- PetroVisual is the best of both worlds — the power of a desktop, and the flexibility of the cloud. We use a cloud settings server to manage user profiles, data connections, and user collaboration.
- Create new users, assign user privileges, create new database connections, and publish new data views – your changes are instantly deployed to your users.

Query
A consistent query interface to all your data sources that allows you to ask simple or complex questions about your data.
Queries
Ask detailed questions about your data with intuitive English commands like Equals, Contains, Between, and Starts With. PetroVisual provides real-time access to your data so you can browse for specific keywords and get record counts, right from the query editor.


Filters
- Queries are great for asking questions about your data and focusing on what matters most.
- Filters act as a secondary query allowing you to subset your query results and explore data in more detail.
Query Collaboration
-
Share and manage PetroVisual queries in the cloud to improve project management, employee engagement, and data workflows.
-
Collaborate with users across your company or specific teams.
-
Leverage common data queries and visualizations for monthly reports, frequent tasks, and more.

Data Security
- PetroVisual places the highest priority on the security of your data.
- Remain in complete control over who can access your data and how your data is used.
- Configure strict security levels, even down to the individual data field and row level, so users only see the data that they are supposed to see.
Visualize
Most BI applications are designed for data analysts and are too complex for general users. We focus on ease of use and flexibility to increase productivity for all users.
Layouts
- Layouts are preconfigured shortcuts to visualization settings.
- Save and reuse often-used visualizations to analyze data faster and improve productivity.
- Access your own library of layouts or access corporate layouts shared with all users.

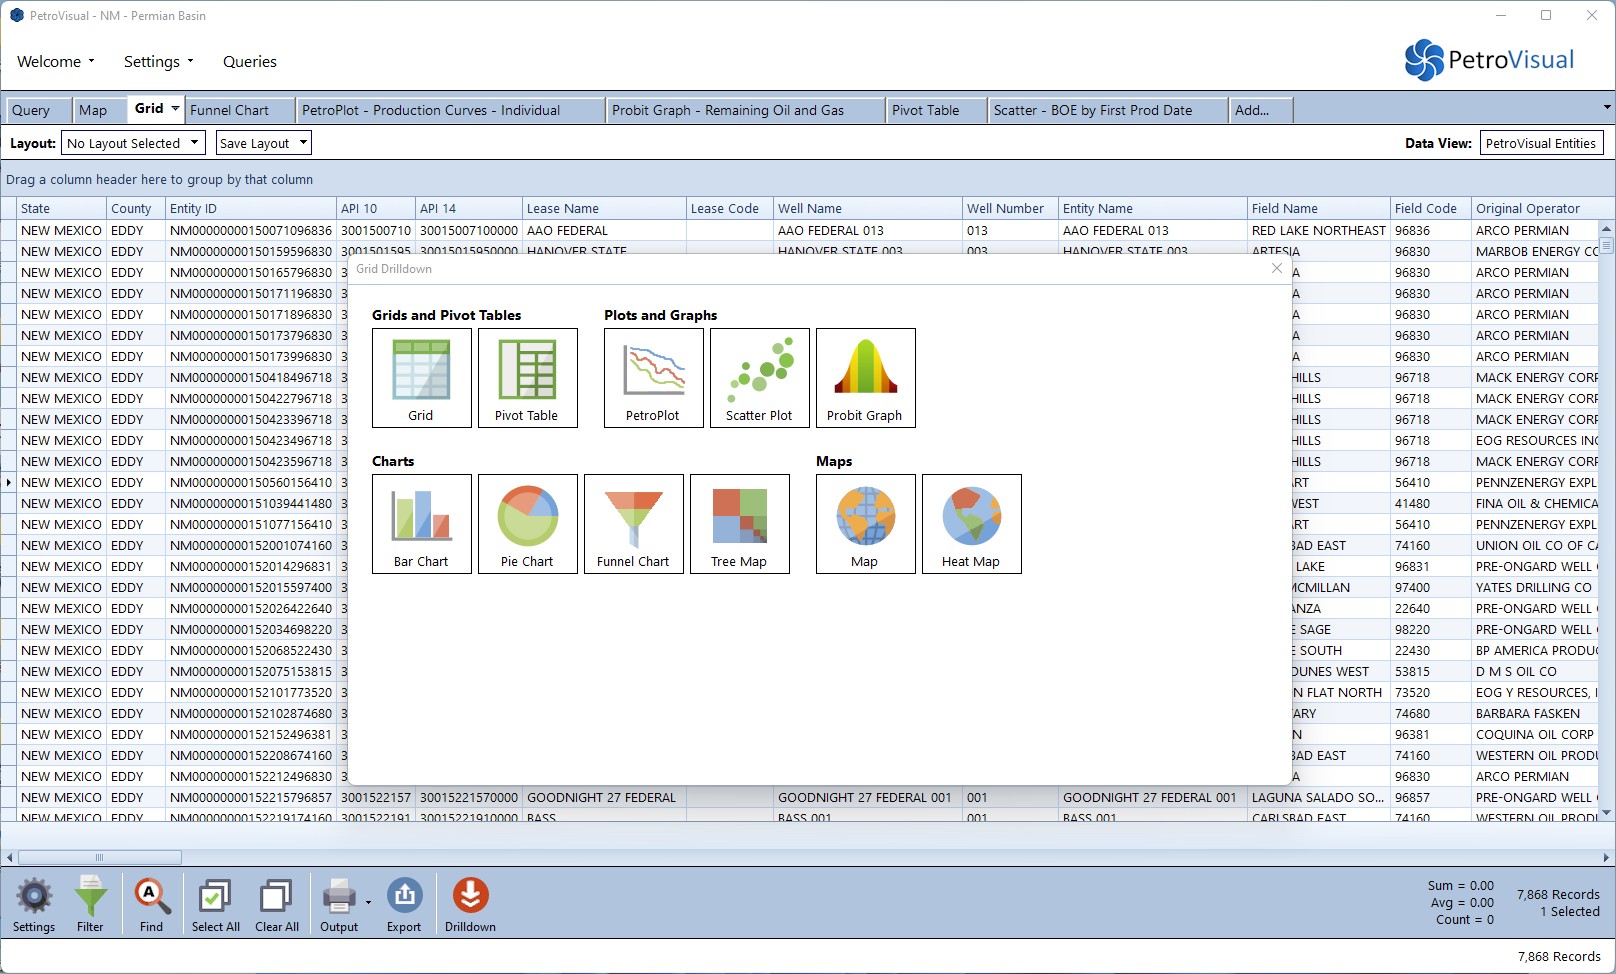
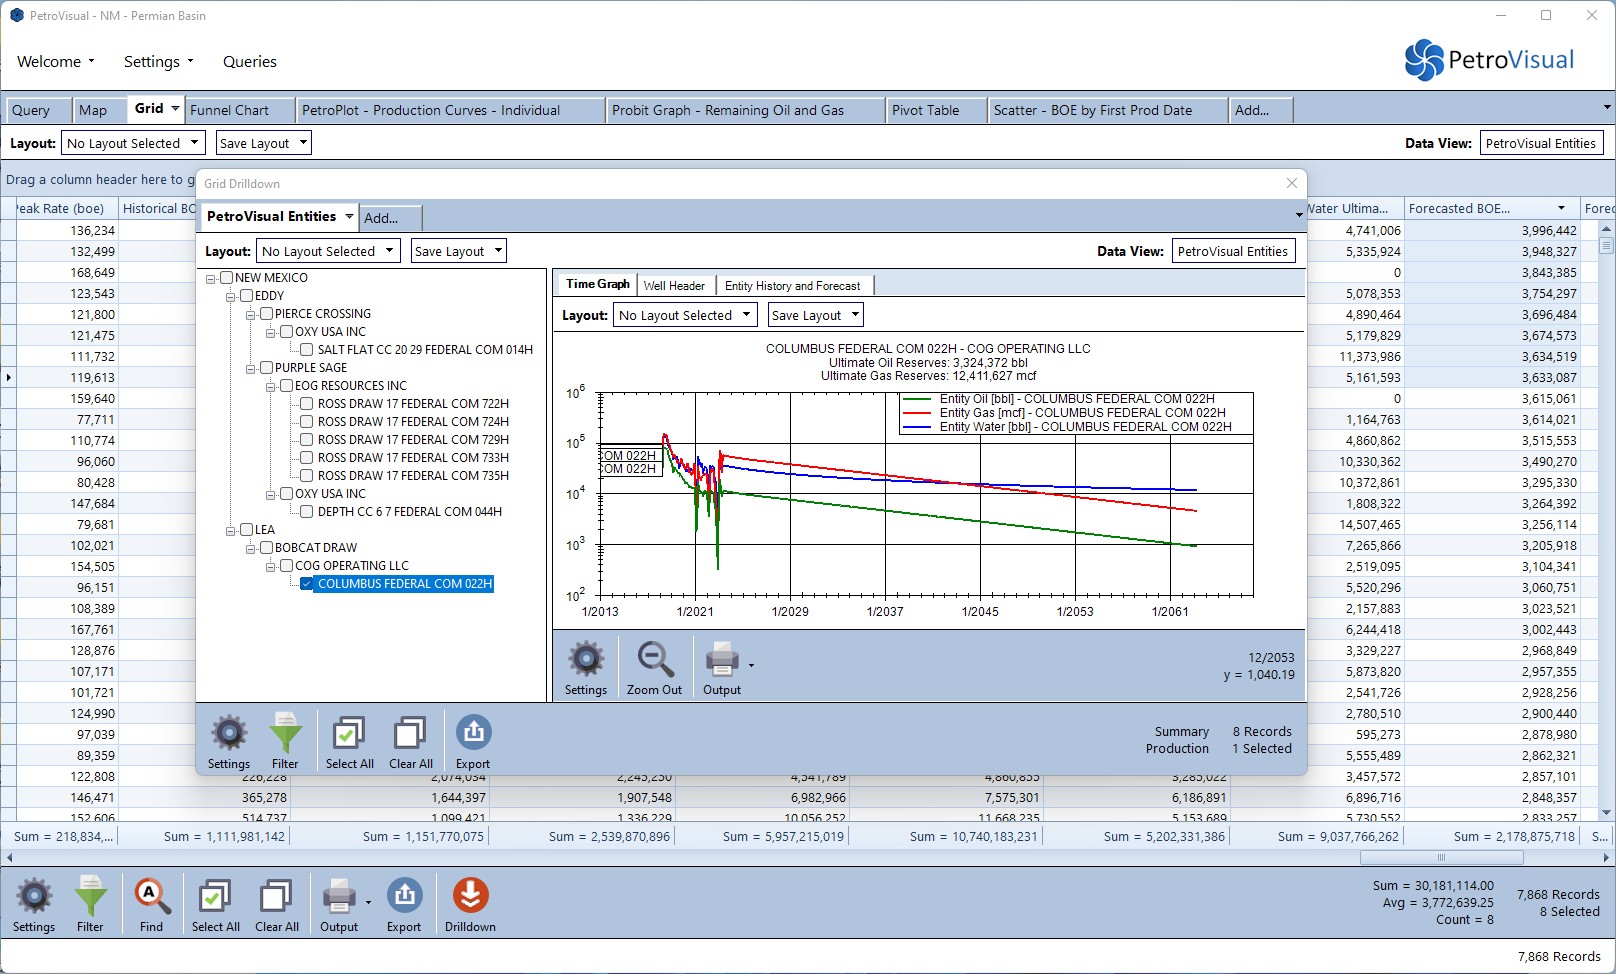
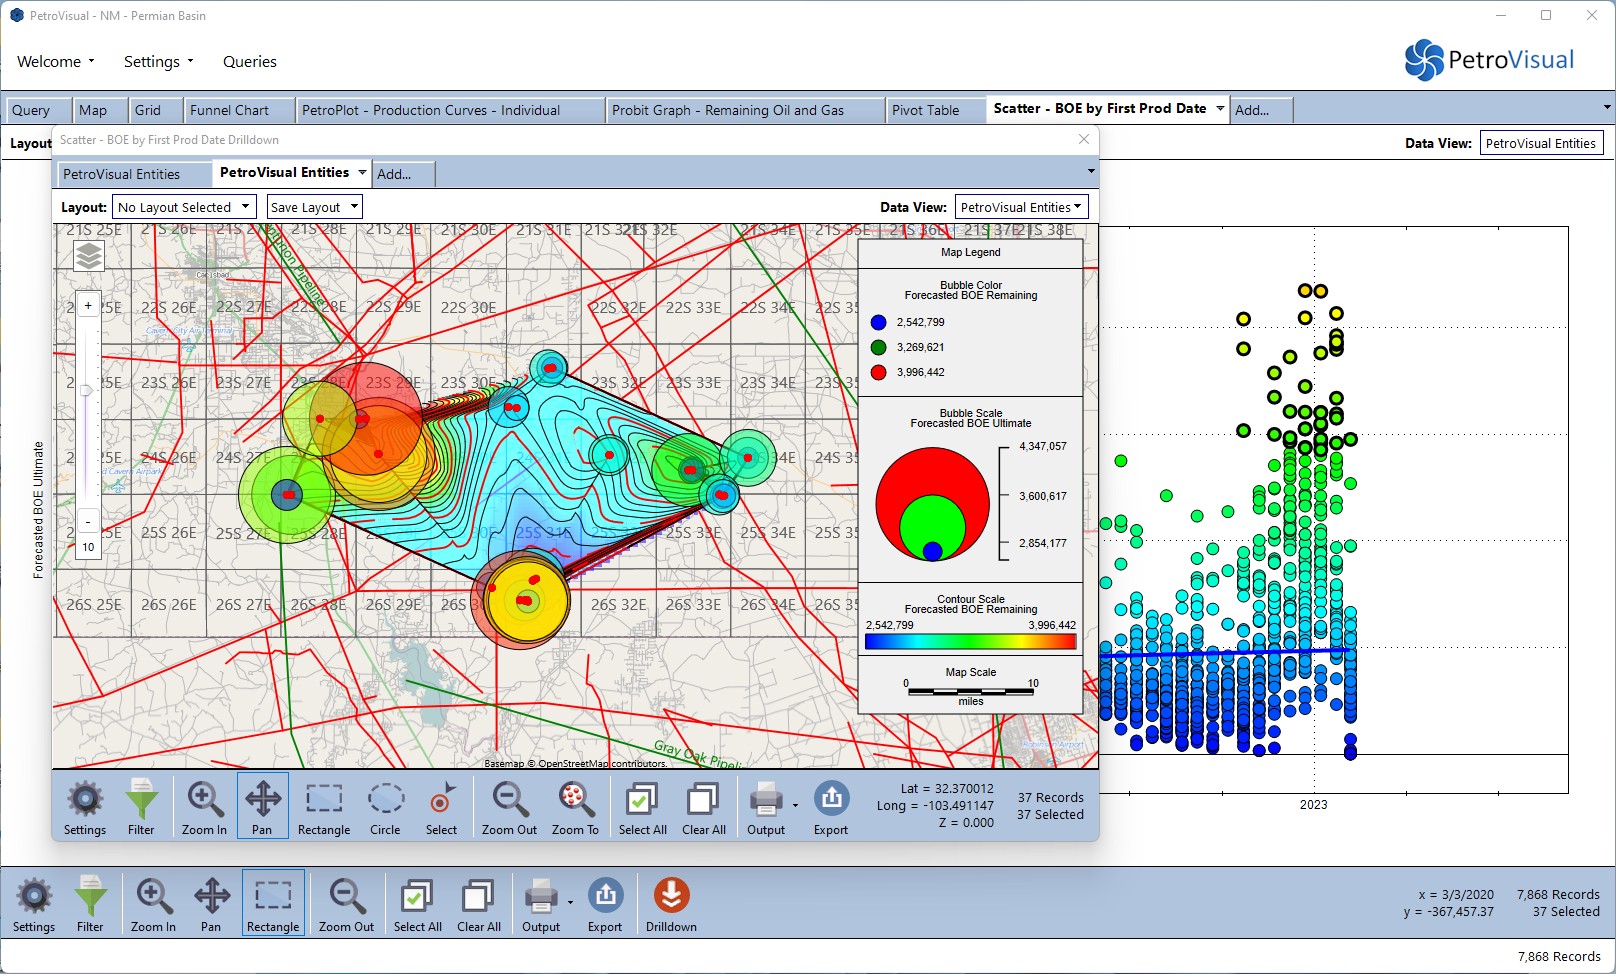
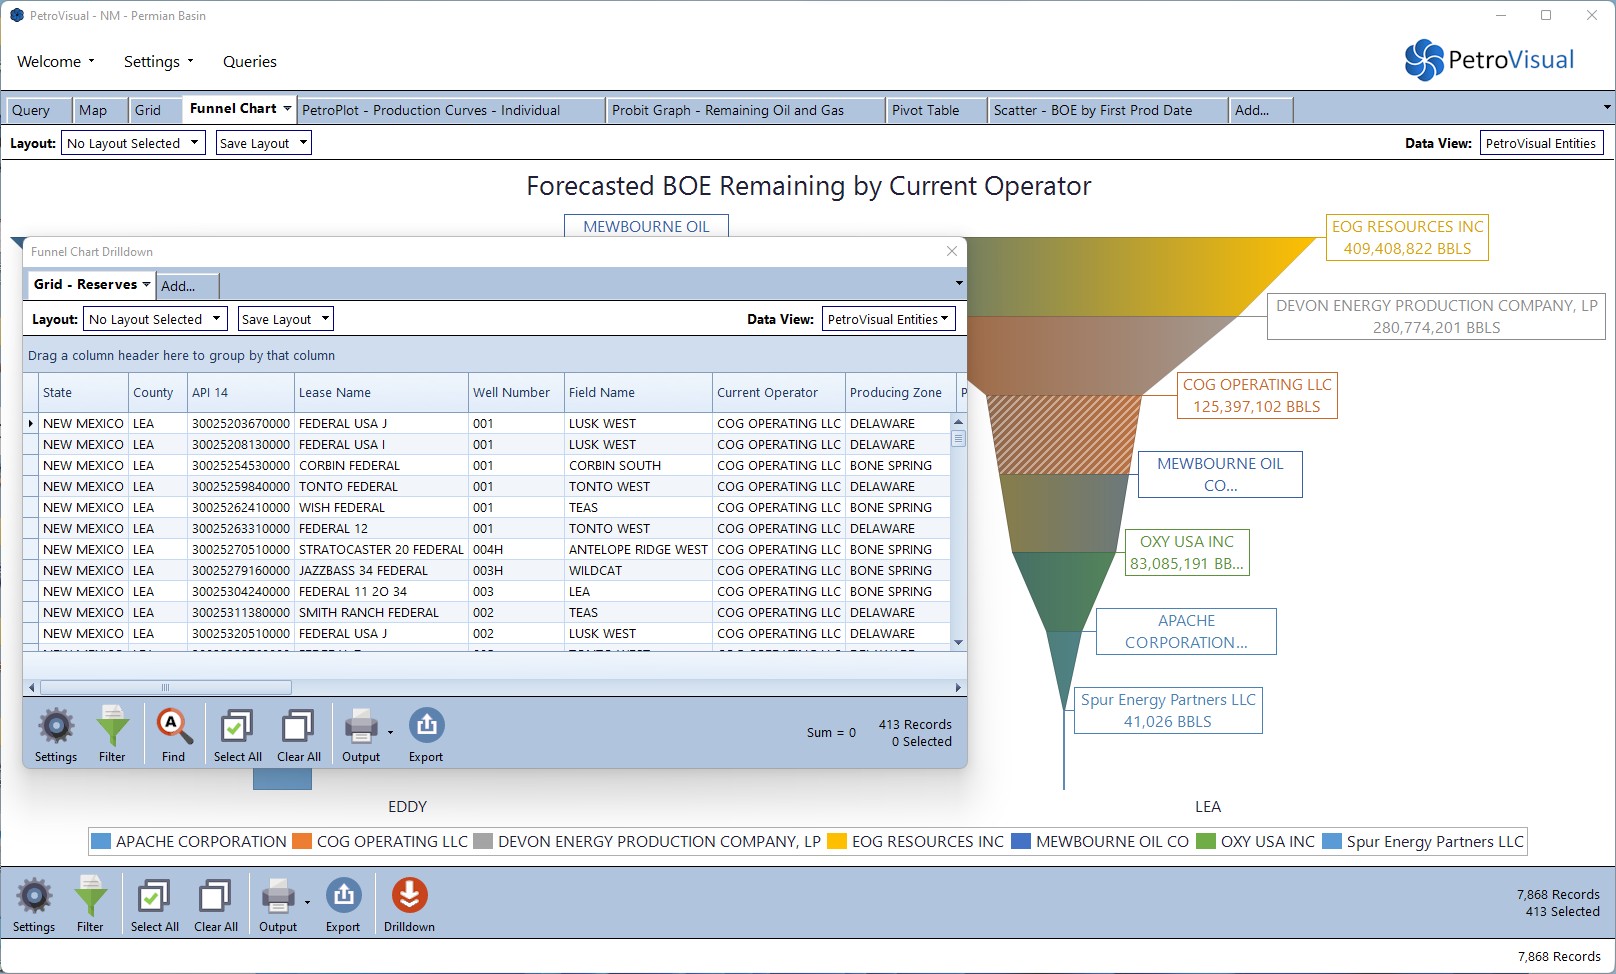
Drilldowns
- All visualizations support “drilling down” to reveal the data behind the data.
- Select a bar in a chart, a group of data in a grid, or a cell in a pivot table and drill down to create new visualizations allowing more in-depth analysis.
- Problems are multidimensional, shouldn’t your BI application also be? Unlike other BI tools, we easily allow you to drill down into related data, even in other databases, thanks to our unique connection technology.
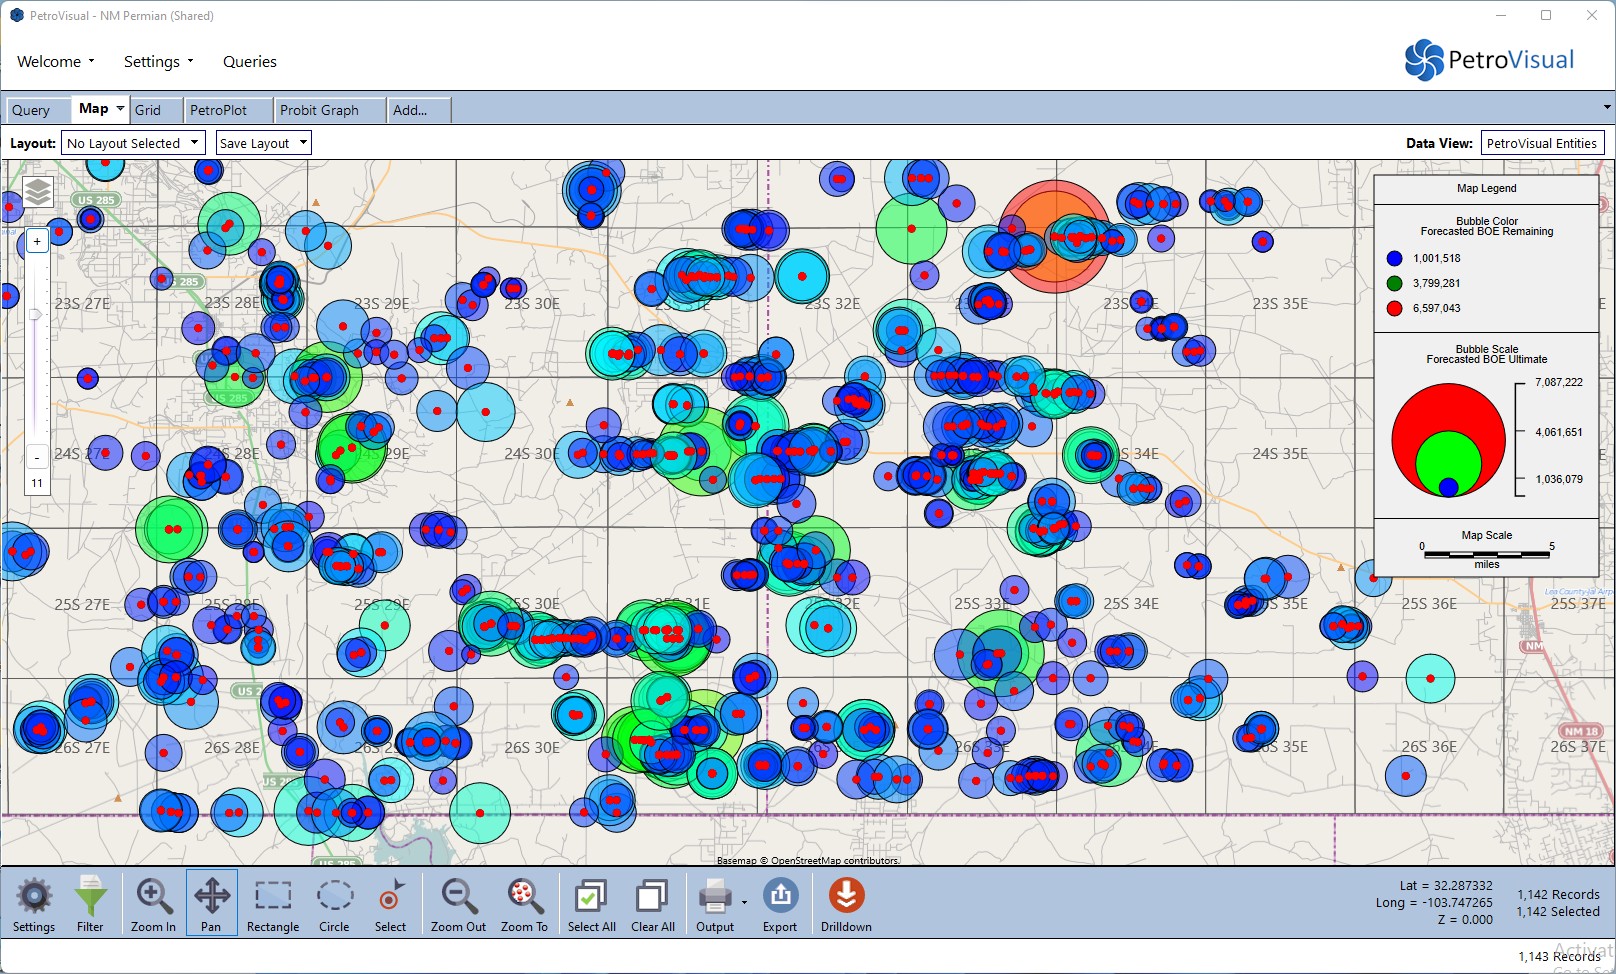
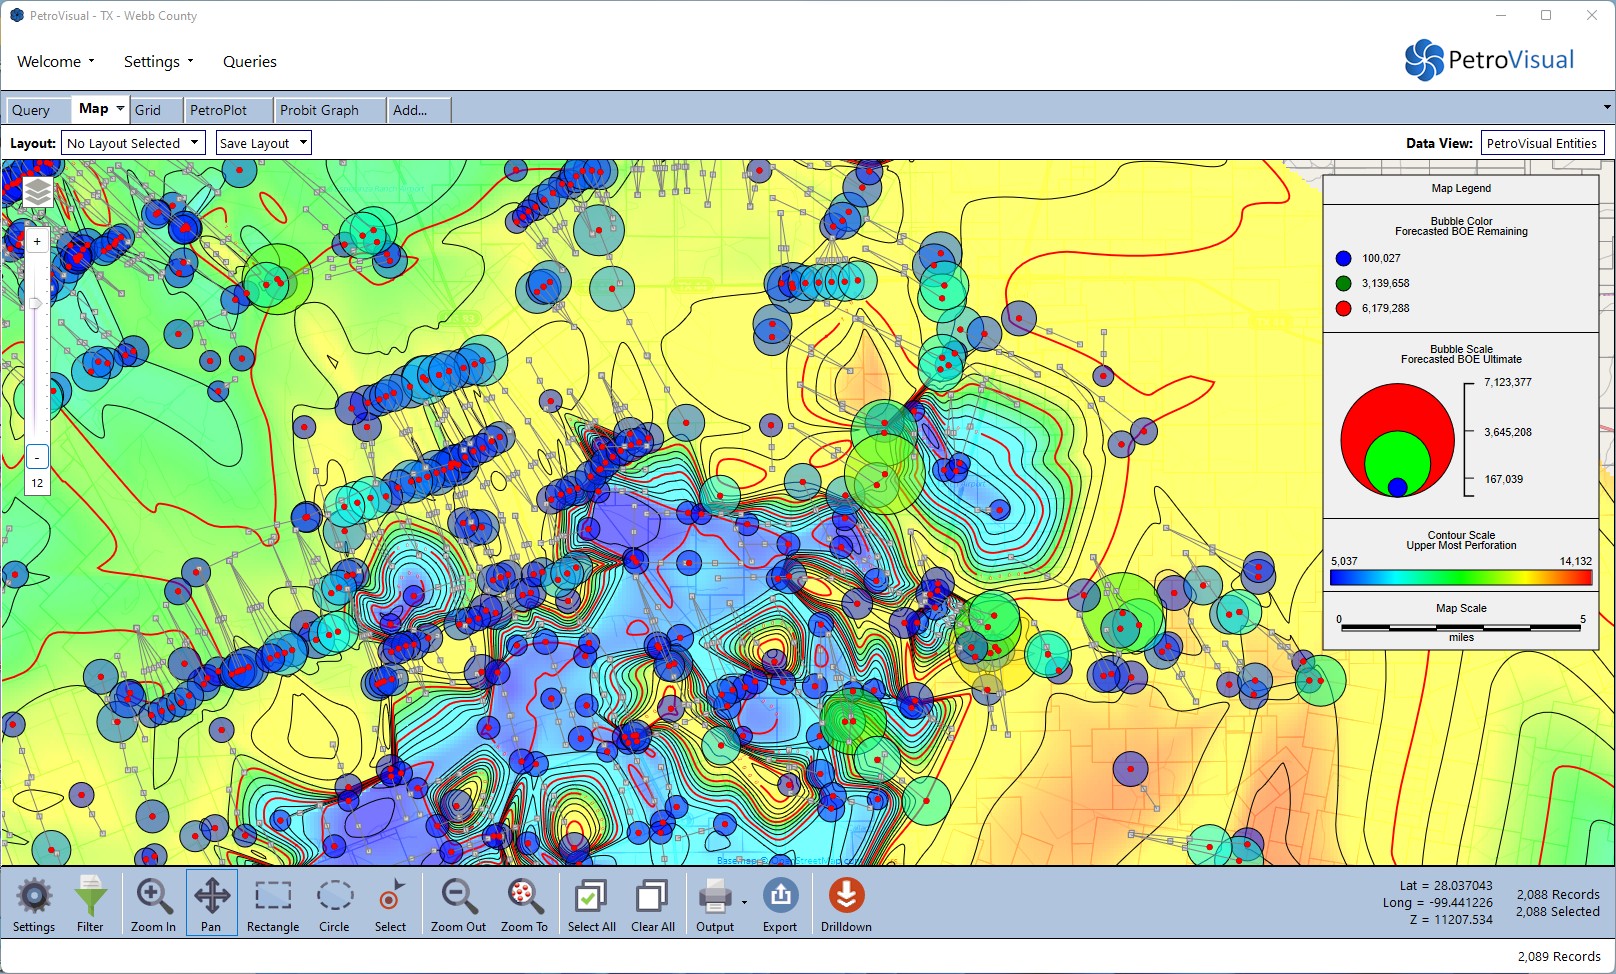
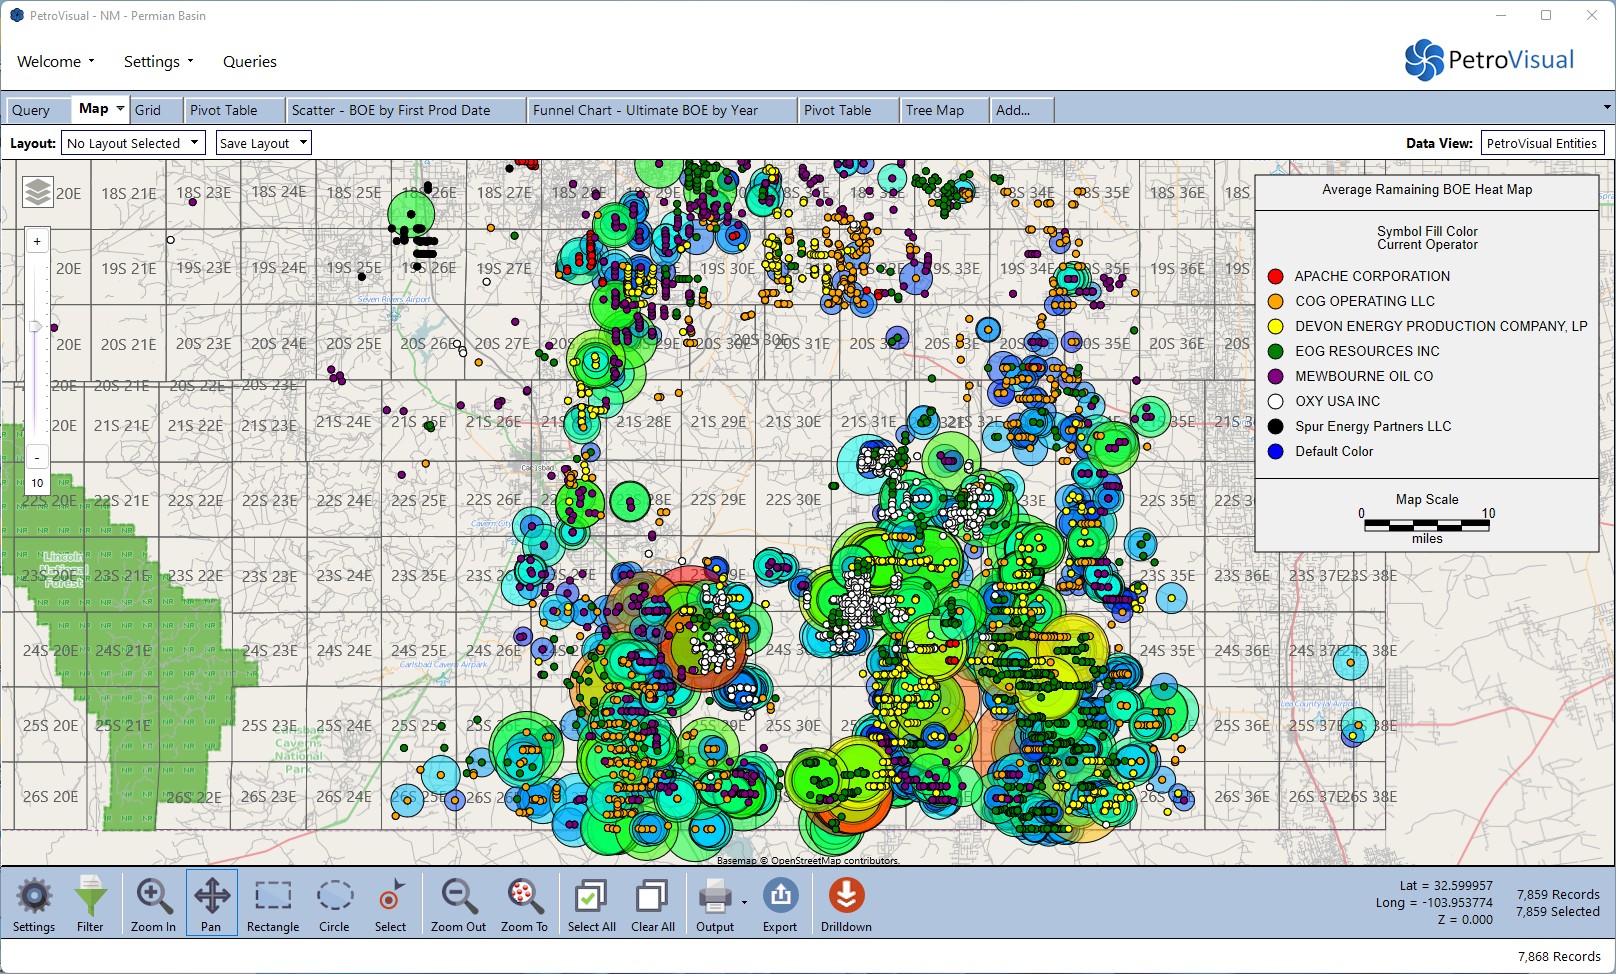
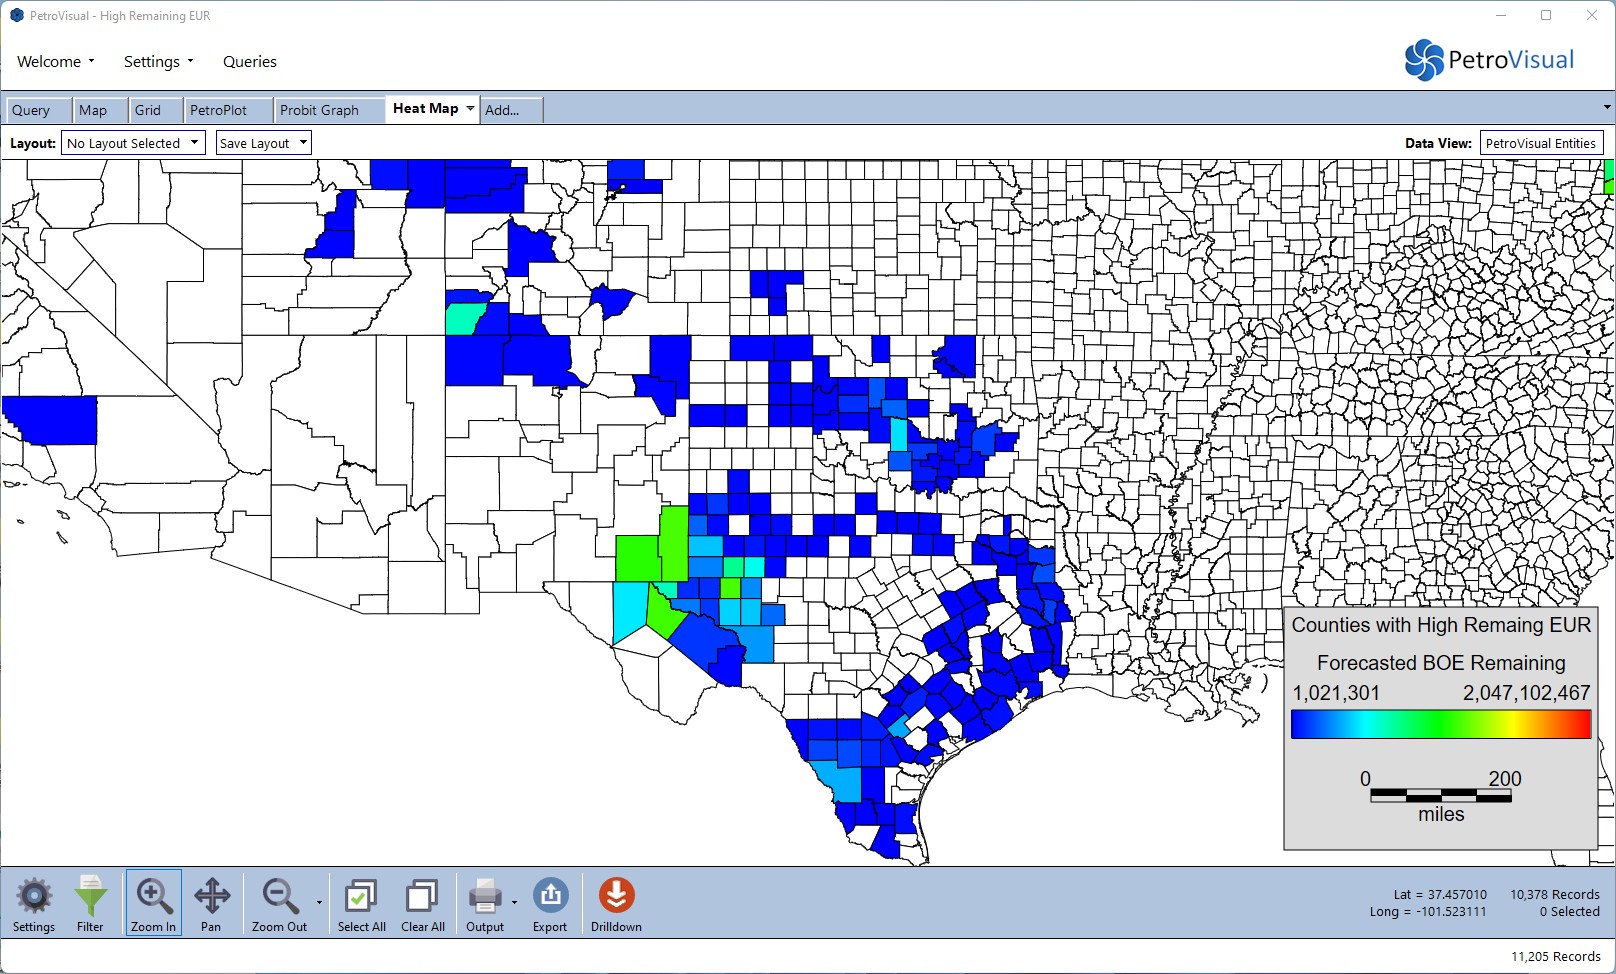
Maps
- Create visually stunning contour maps, bubble maps, and heat maps to analyze thousands of data points with a single picture.
- Plot your map data and shapefiles on top of culture layers that include land grid, cities, roads, and more.
- Take advantage of powerful spatial intelligence without paying the high costs of typical GIS software.
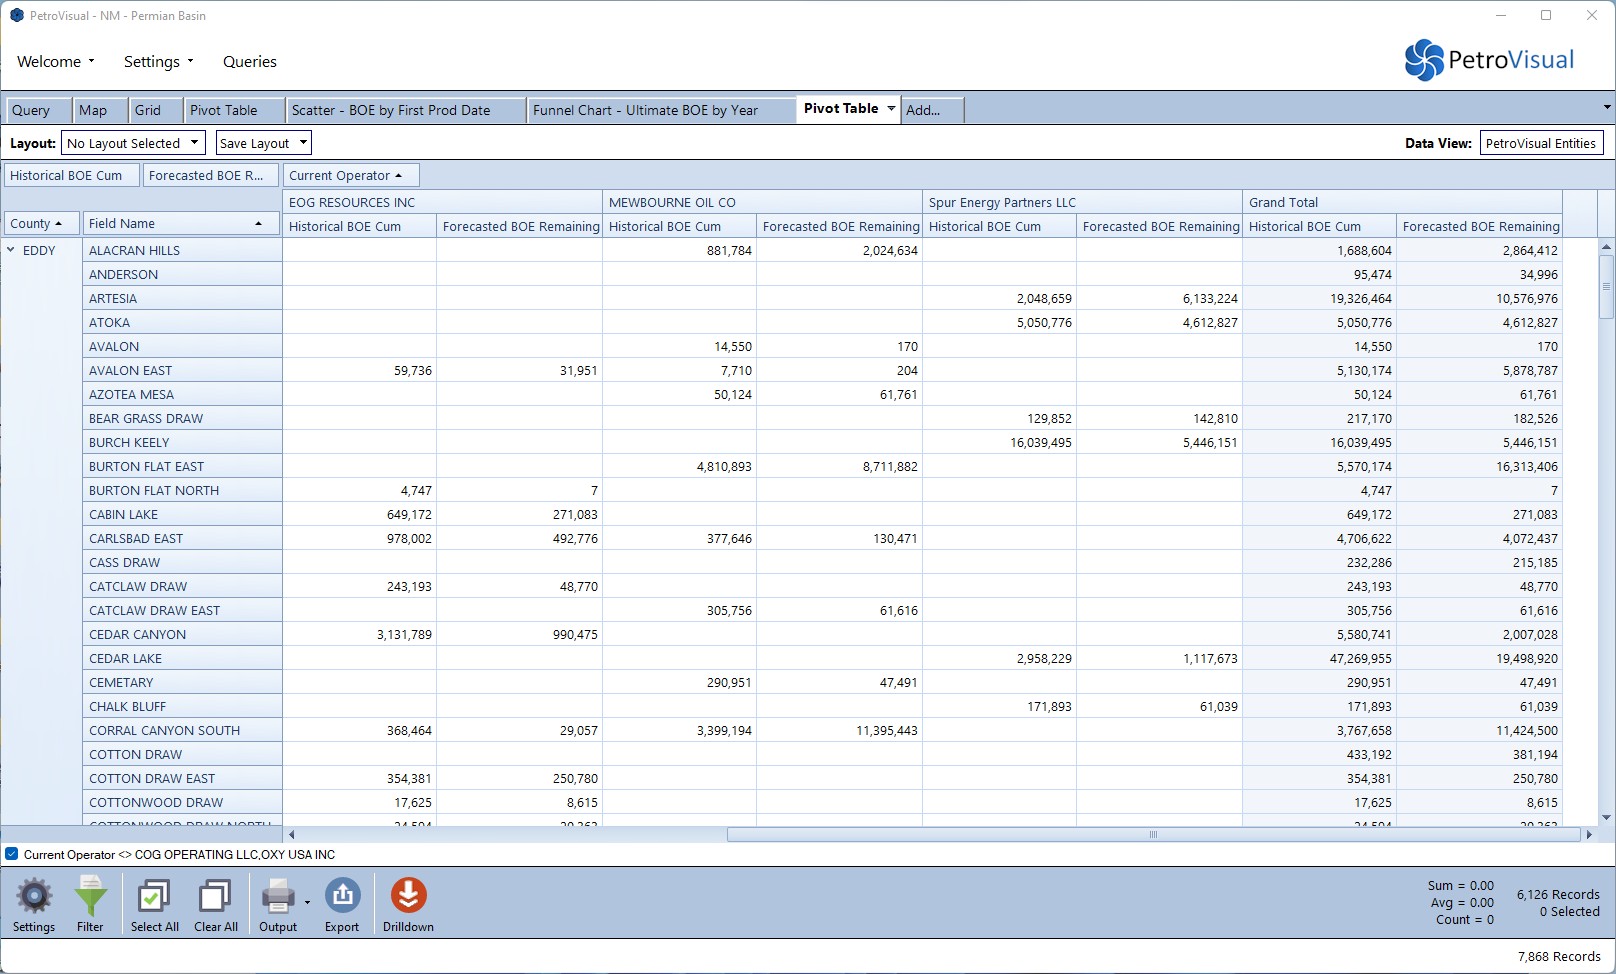
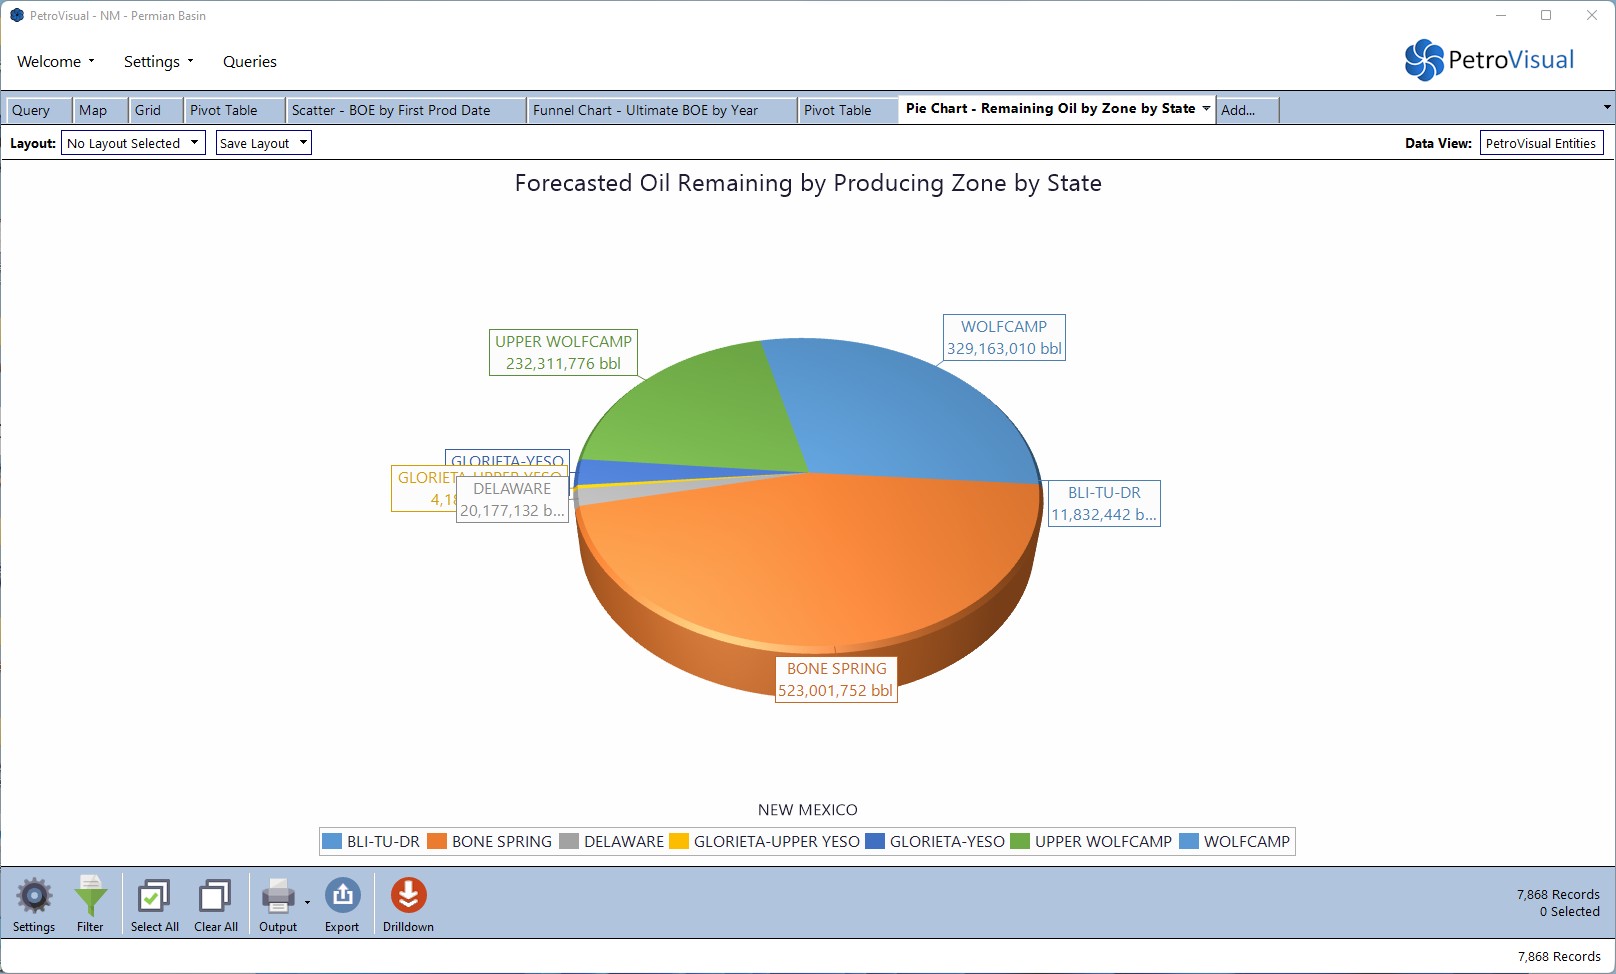
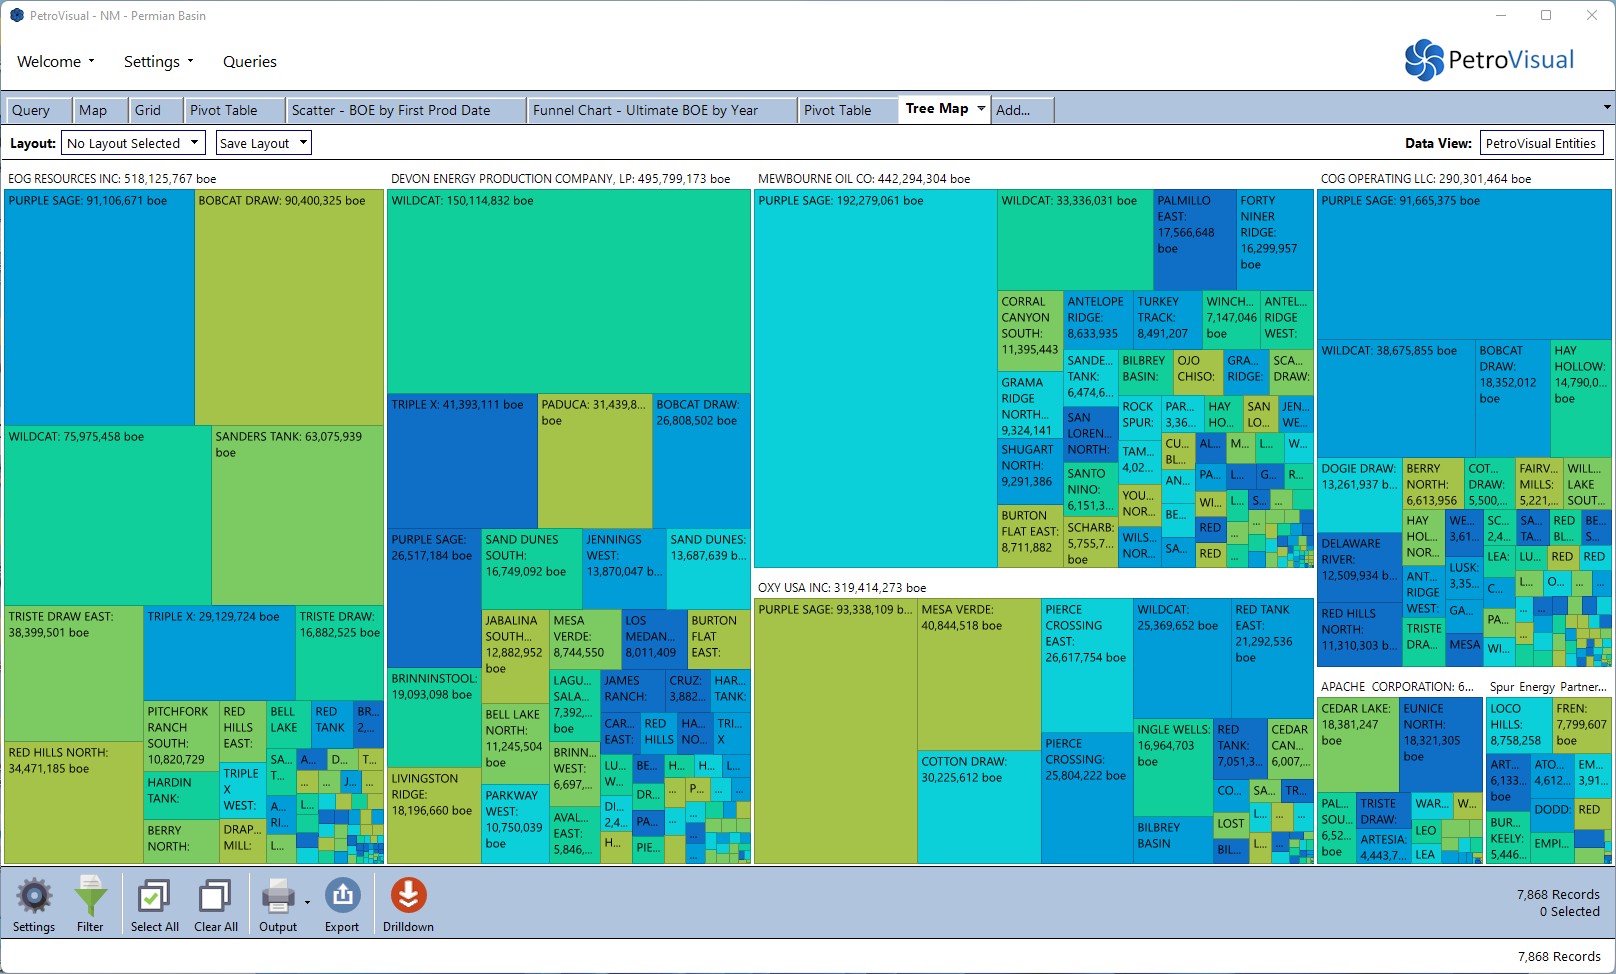
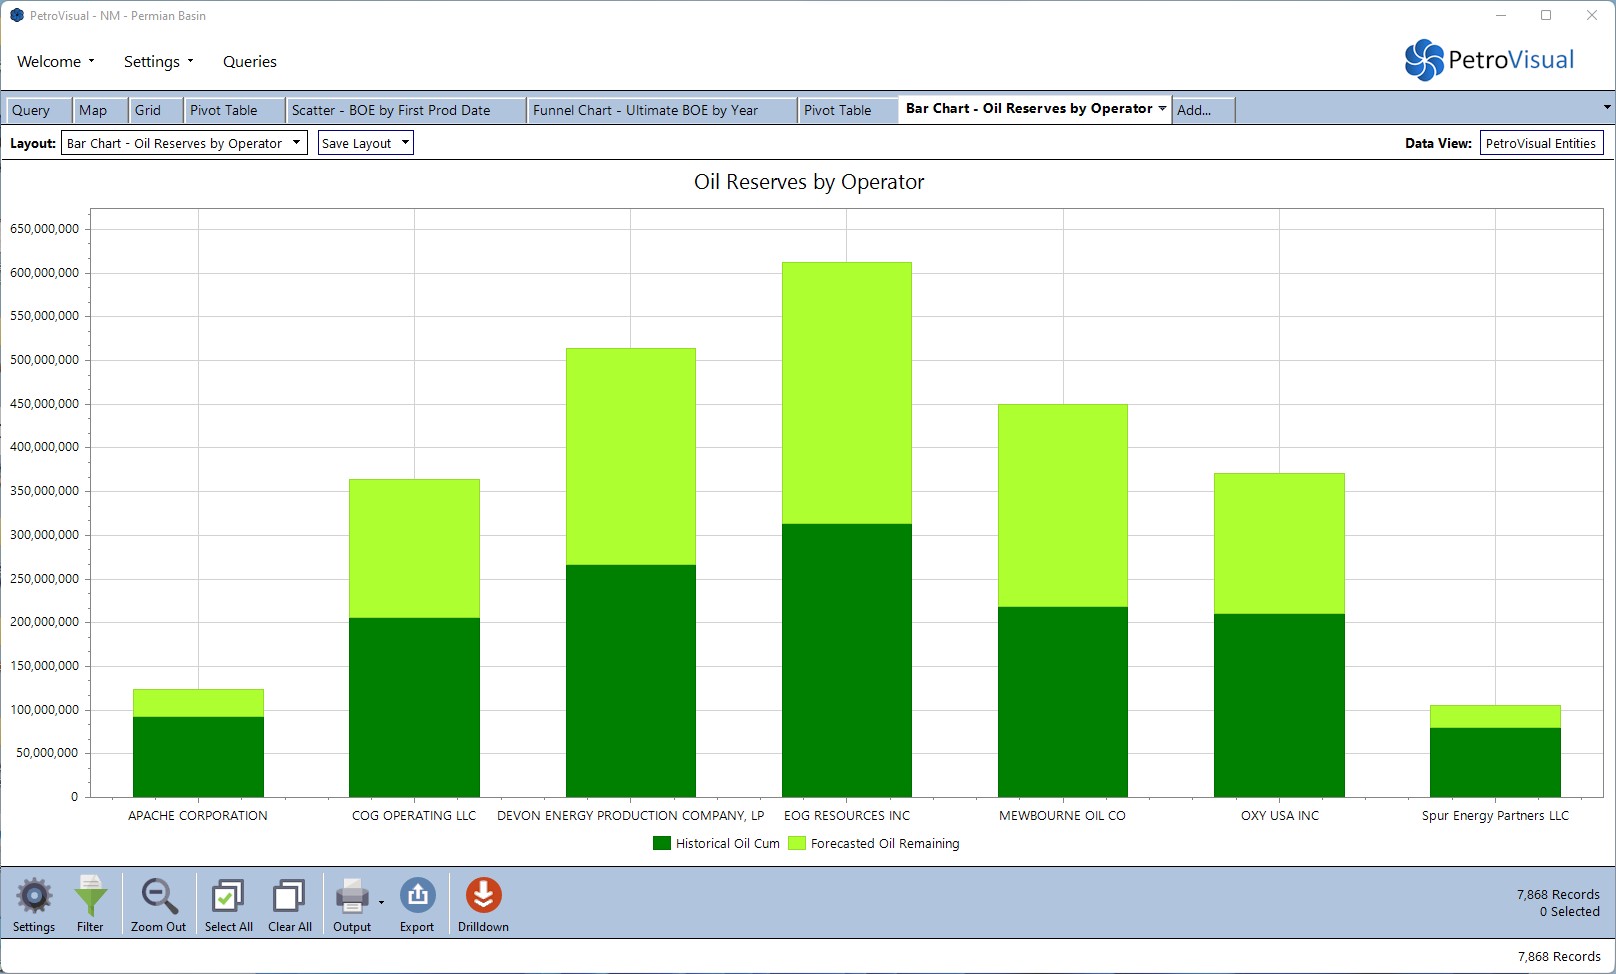
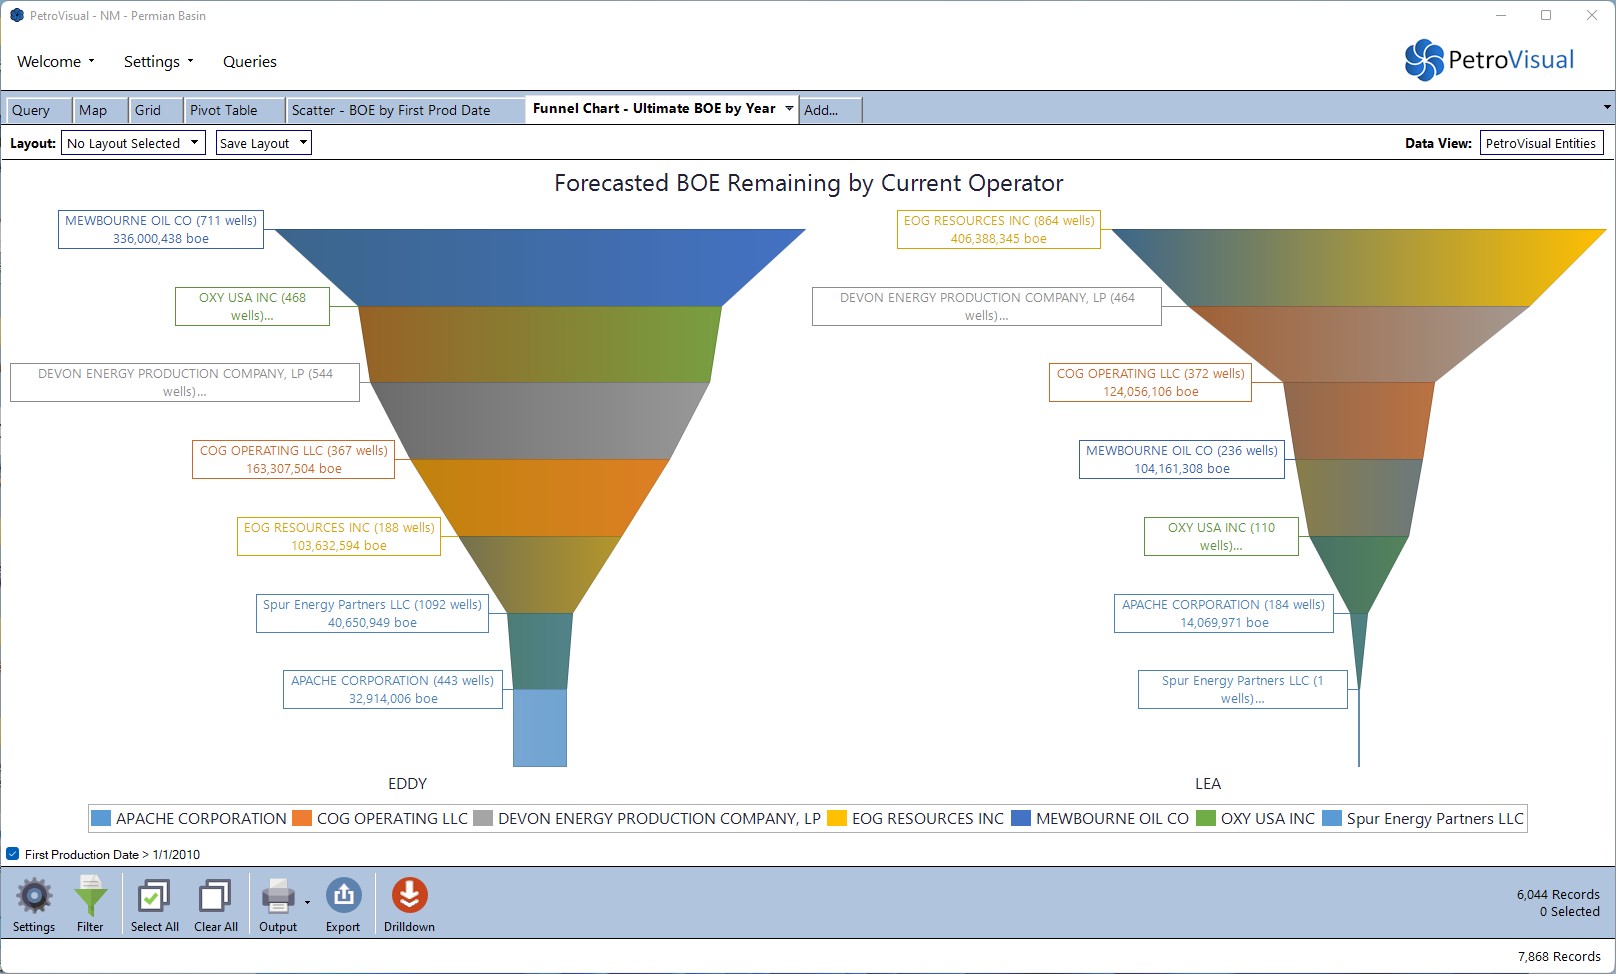
Pivot Tables, Charts, Graphs, and More
- PetroVisual offers many additional tools to analyze and understand your data.
- From bar charts and pie charts to grids and pivot tables, PetroVisual gives you powerful insight into your data.
Specialty Oil & Gas Visualizations
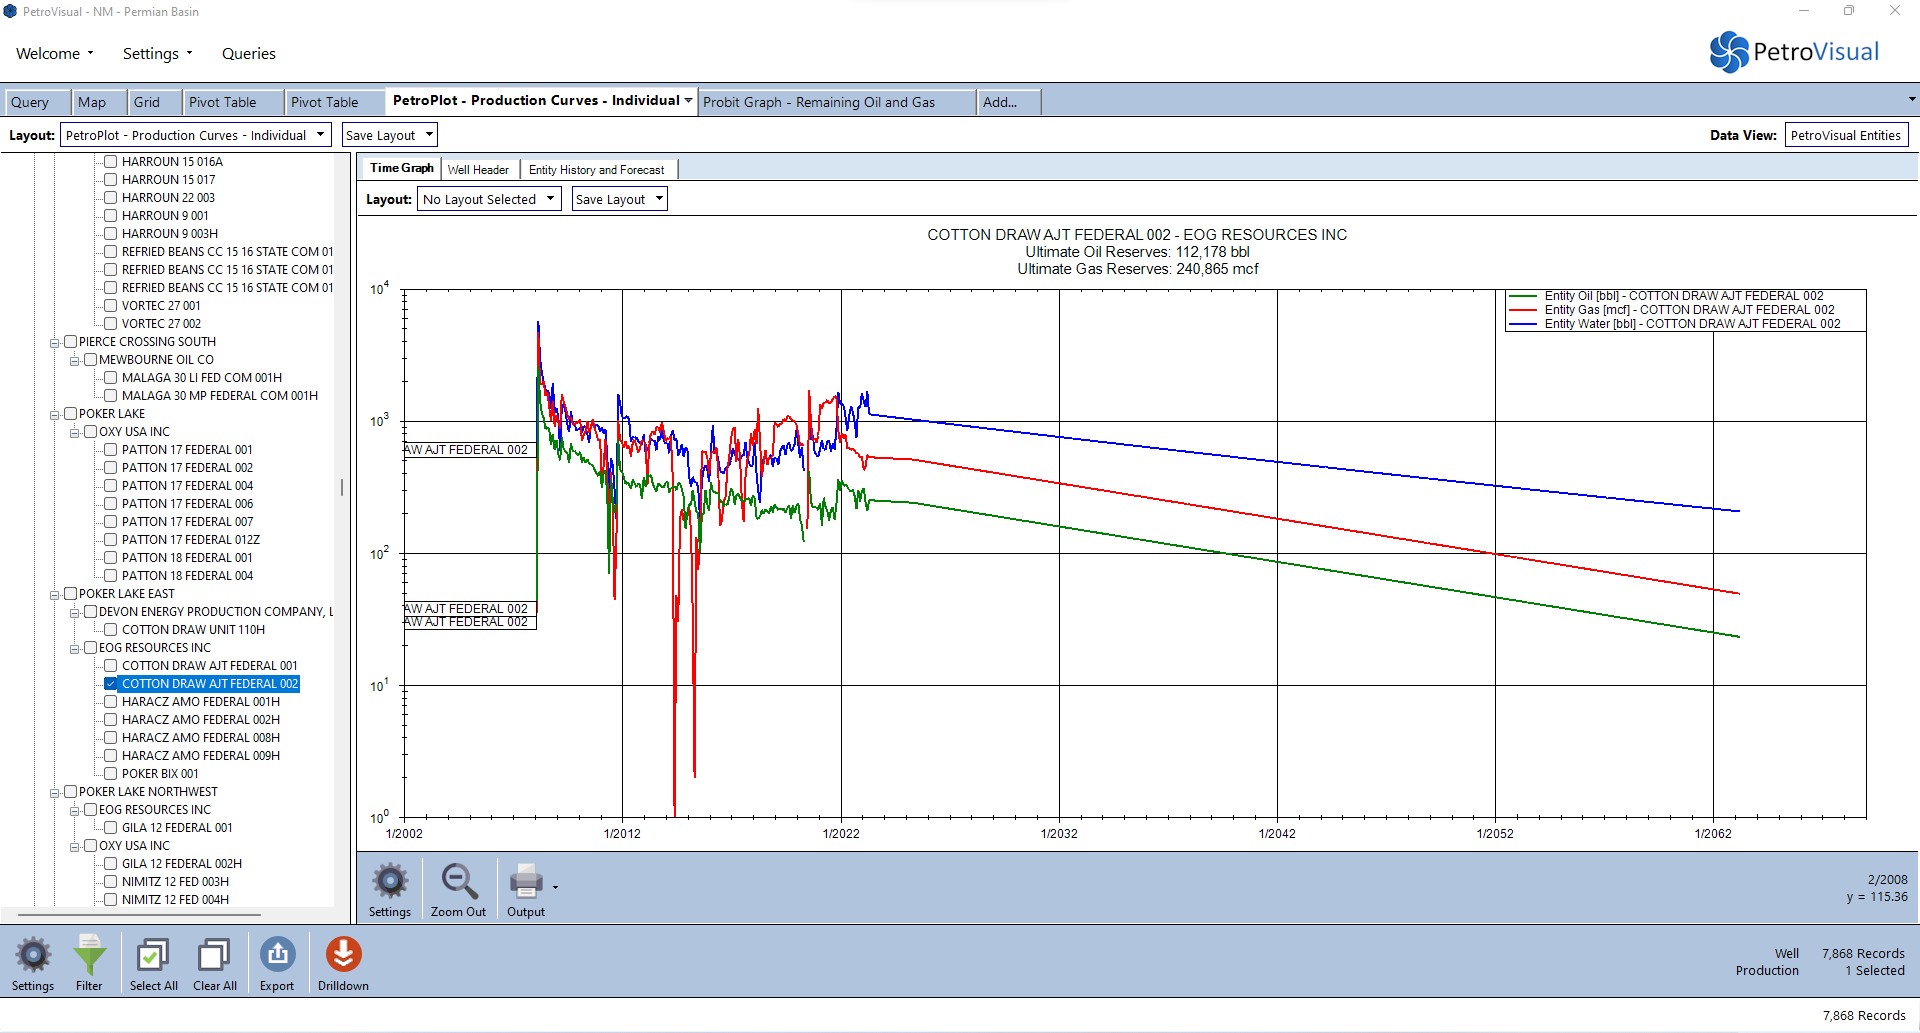
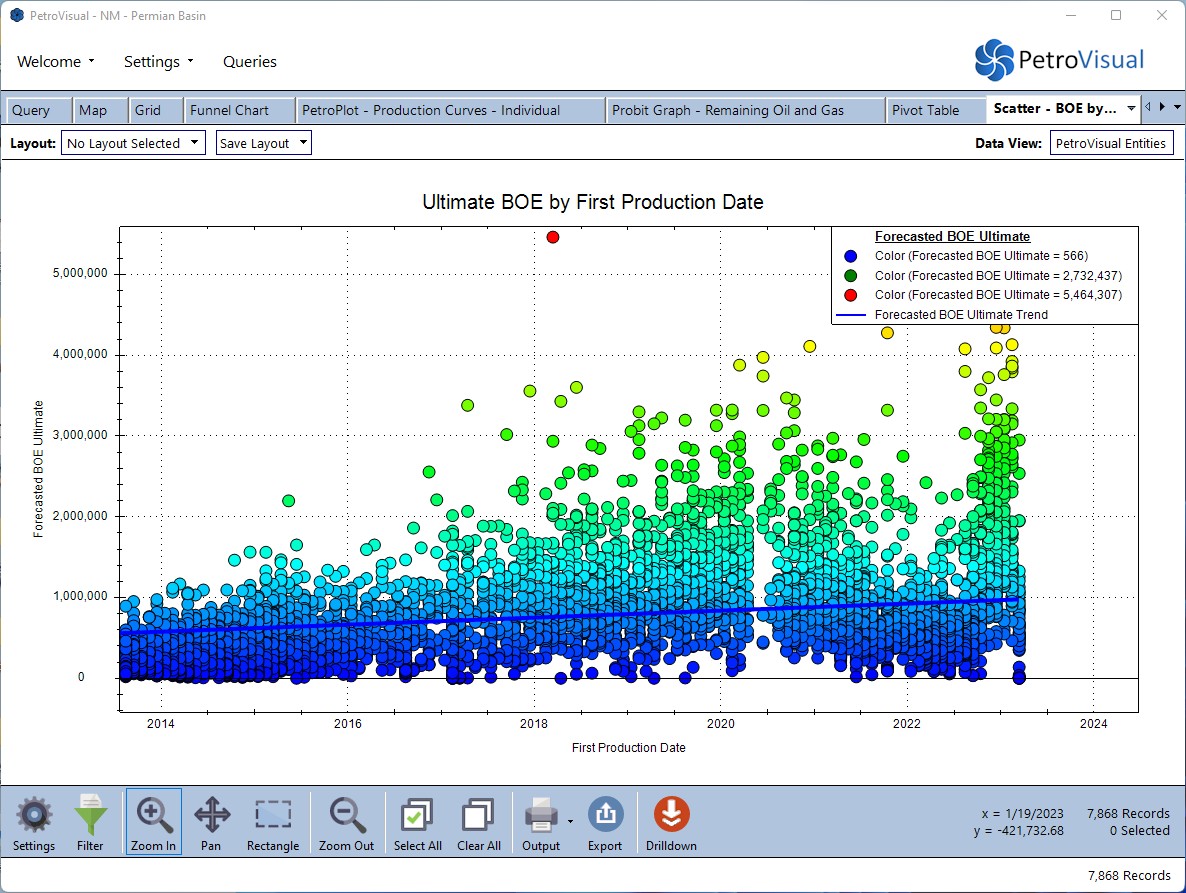
PetroPlot
- Plot your production and reserves values in a powerful, interactive graph by individual or multiple wells, or well summaries.
- Group production by operator, field, reserve category, and more.
- Create type curves with a single mouse click.
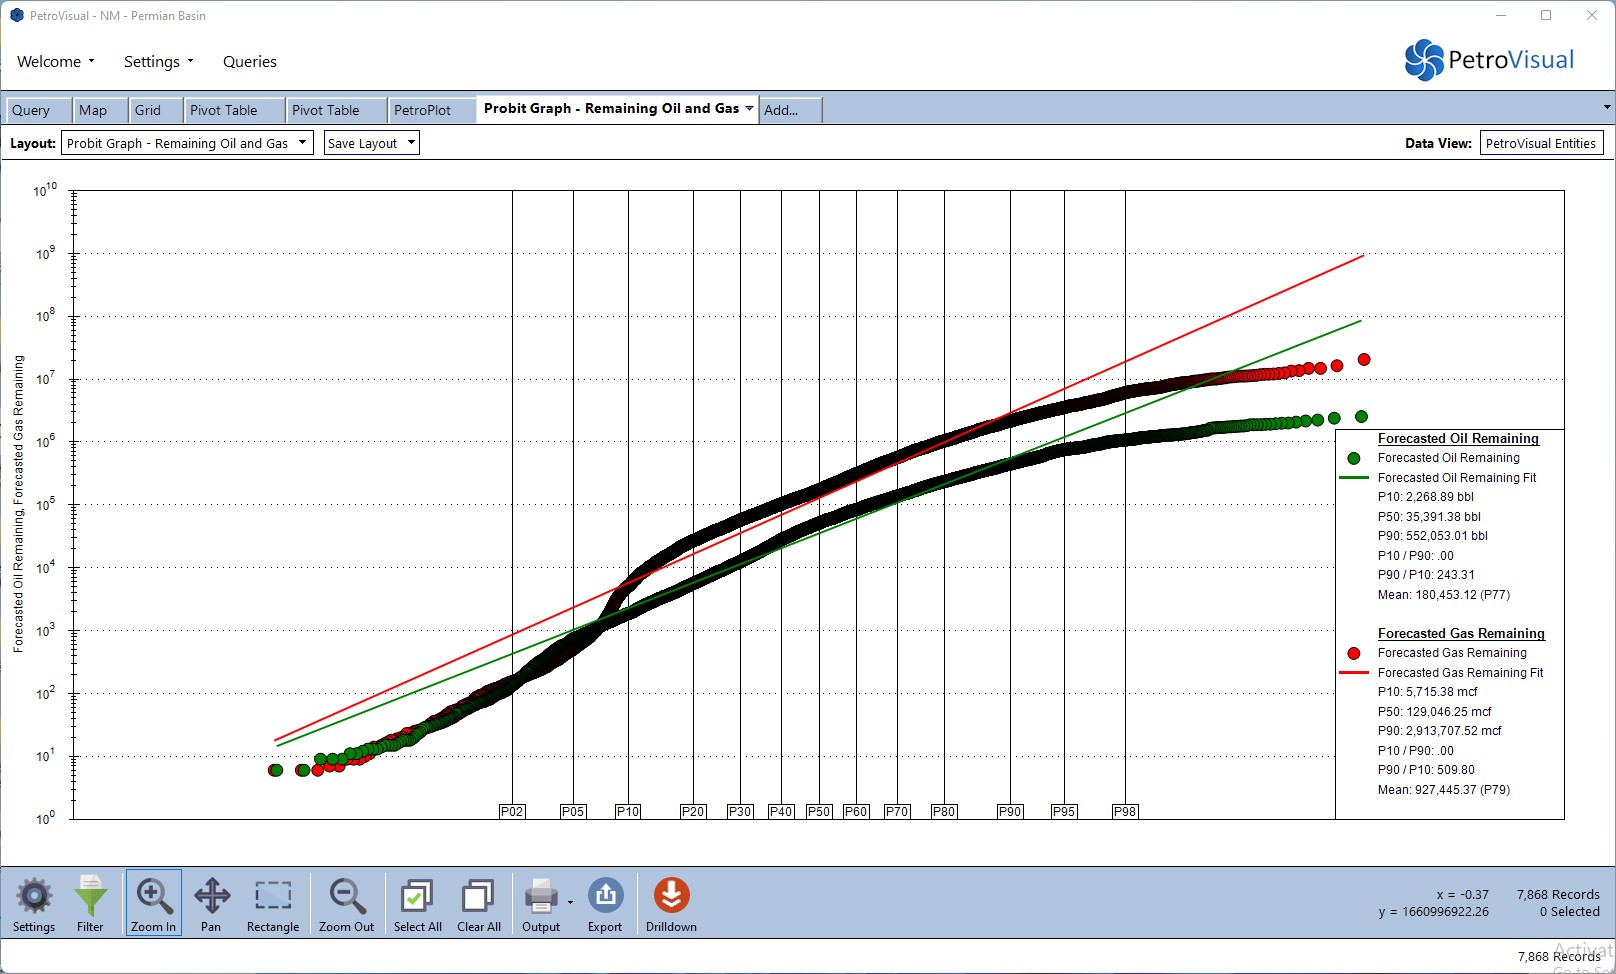
Probit
- View the distribution of forecasted reserves and porosities on a probabilistic scale.
- Probit supports multiple data sets, presents you with a linear fit of each data stream, and displays the associated curve values like P10, P50, and P90.